Our market relevance
70%
Automobile: 70% of manufacturers have implemented or plan to adopt AI-driven predictive maintenance to reduce downtime and enhance productivity.
30%
Manufacturing: ML-powered personalized marketing can increase customer conversion rates by up to 30%
85%
Real Estate: 85% of real estate companies believe data analytics is critical for understanding market trends and customer behavior.
Our services
Data Advisory Services

Optimize your data strategy, governance, and security
Intelligent Robotic Process Automation

- Process Assessment and Automation Strategy
- RPA implementation
- Cognitive automation
- Bot Monitoring and Maintenance
Data engineering

- Data integration and ETL
- Data warehousing and data lakes
- Big data processing
- Data quality & governance
- Real-time data streaming
AI/ ML

- AIML consulting
- Custom AI solutions
- Predictive analytics
- Natural Language Processing
- Computer Vision
Data Visualization

- Power BI
- Qlik
Master Data Management

- Ensure data accuracy, consistency, and governance across the organization
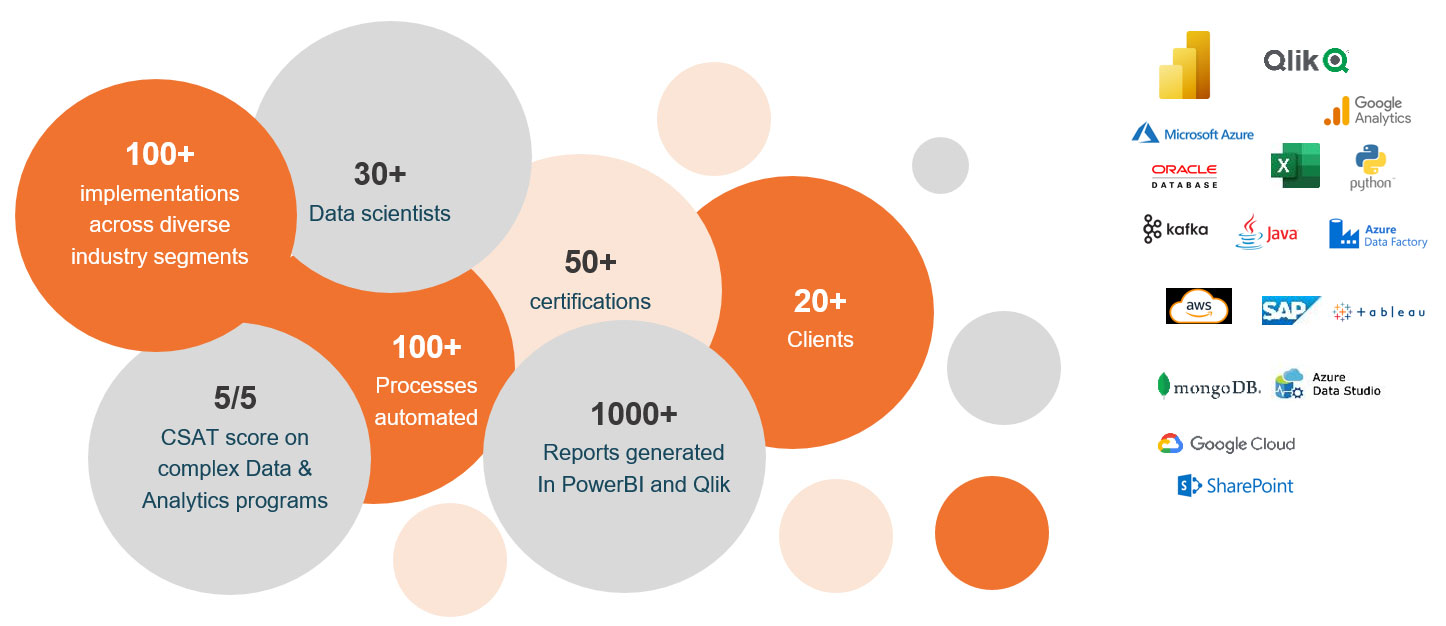
Krios’ Data & Analytics delivery excellence
What you can expect working with us
Domain expertise

Extensive experience in providing data and analytics solutions to diverse industries.
Customized solutions

Tailored solutions to meet unique business needs.
Fast implementation

Rapid deployment of solutions to accelerate time-to-value.
End-to-end support

Our team ensures that any issues are resolved quickly
Unparalleled expertise

A skilled team of data scientists, analysts, and consultants.
Customer testimonials

Positive feedback from satisfied clients attesting to our excellence.
Comprehensive offerings

A wide range of data and analytics solutions under one roof.
Innovation focus

Embracing the latest technologies and industry best practices.
Industry specific benefits we offer
Automobile
- Optimized inventory management with AI-driven demand forecasting.
- Predictive maintenance to minimize downtime and improve vehicle reliability.
- Personalized customer experiences through data-driven marketing.
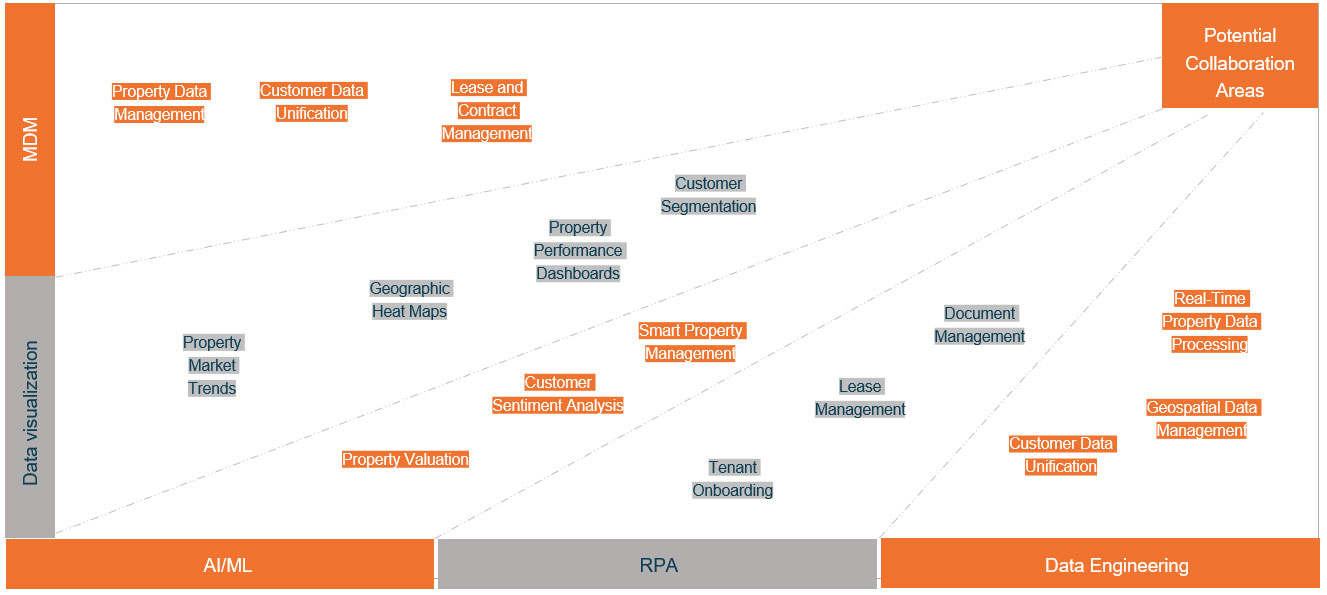
Potential collaboration areas in Automobile
Manufacturing
- Improved production efficiency & reduced downtime through predictive maintenance.
- Enhanced supply chain management for better inventory control & cost savings.
- Real-time monitoring and analysis of key performance indicators (KPIs).
Potential collaboration areas in Manufacturing

Real estate
- Enhanced property valuation with ML-based property price predictions.
- Deeper market insights and competitive analysis for informed decision-making.
- Improved customer engagement through targeted marketing strategies.
Potential collaboration areas in Real estate

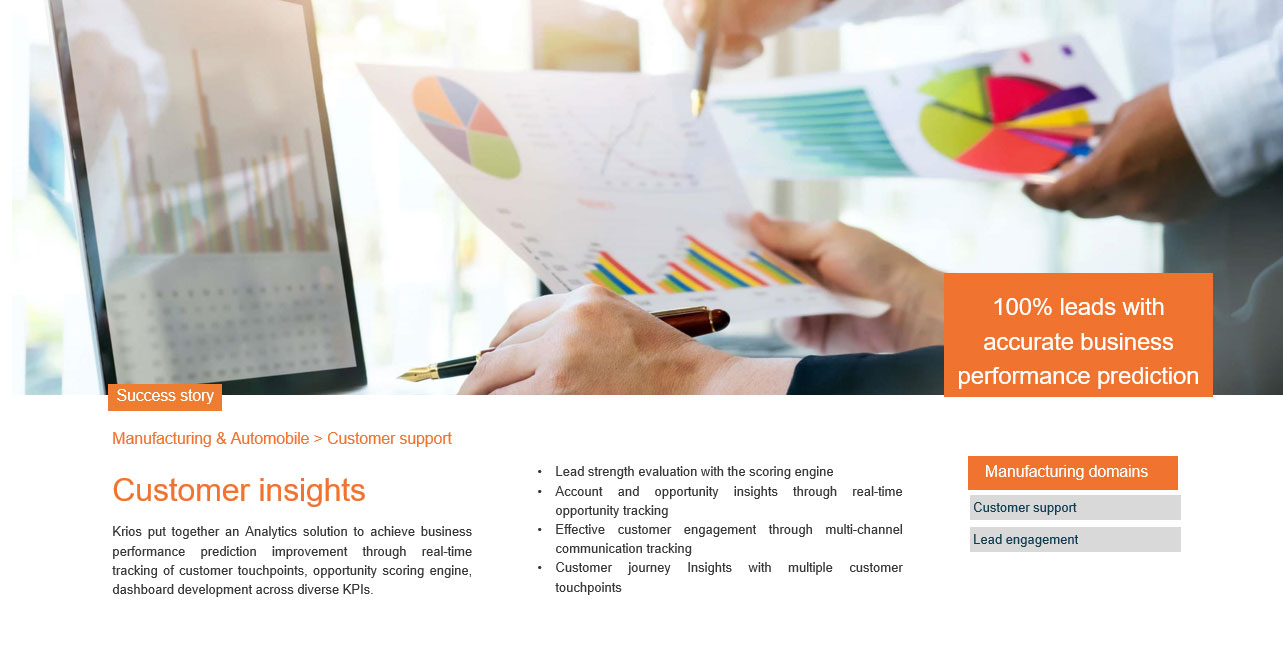
Case studies